Violent and Property Crime Rates in 2026: Latest State-by-State Data
October 2, 2026
7 minutes
Violent and property crime rates provide two important measures for understanding public safety in 2026. The latest state-level data shows that crime rates vary considerably between states and between individual cities. Statewide figures provide a broad benchmark, while city-level rates reveal how much crime levels can differ within the same state.
What Are the 2026 Violent and Property Crime Rates?
The 2026 state data shows different violent and property crime rates across New York, New Jersey, California, Florida, and Georgia.
| State | 2026 Violent Crime Rate | 2026 Property Crime Rate |
|---|---|---|
| New York | 5.73 per 1,000 | 23.72 per 1,000 |
| New Jersey | 2.64 per 1,000 | 15.88 per 1,000 |
| California | 4.24 per 1,000 | 20.84 per 1,000 |
| Florida | 3.96 per 1,000 | 20.29 per 1,000 |
| Georgia | 3.42 per 1,000 | 19.76 per 1,000 |
These figures use incidents per 1,000 residents, allowing readers to compare crime levels across states with different population sizes.
How Do 2026 Crime Rates Differ Between States?
The 2026 data shows meaningful differences between statewide crime rates. New York records 5.73 violent crimes and 23.72 property crimes per 1,000 residents. New Jersey records 2.64 violent crimes and 15.88 property crimes per 1,000 residents.
California reports 4.24 violent crimes and 20.84 property crimes per 1,000 residents, while Florida reports 3.96 violent crimes and 20.29 property crimes. Georgia reports 3.42 violent crimes and 19.76 property crimes per 1,000 residents.
Statewide figures do not describe every community. Individual cities and towns can report substantially different crime rates.
Bundle your agent and mortgage. Save an average of $10,000.
Don't have an agent yet? Pair your reAlpha mortgage with a reAlpha agent, and you could get up to 1.5% cash back at closing.
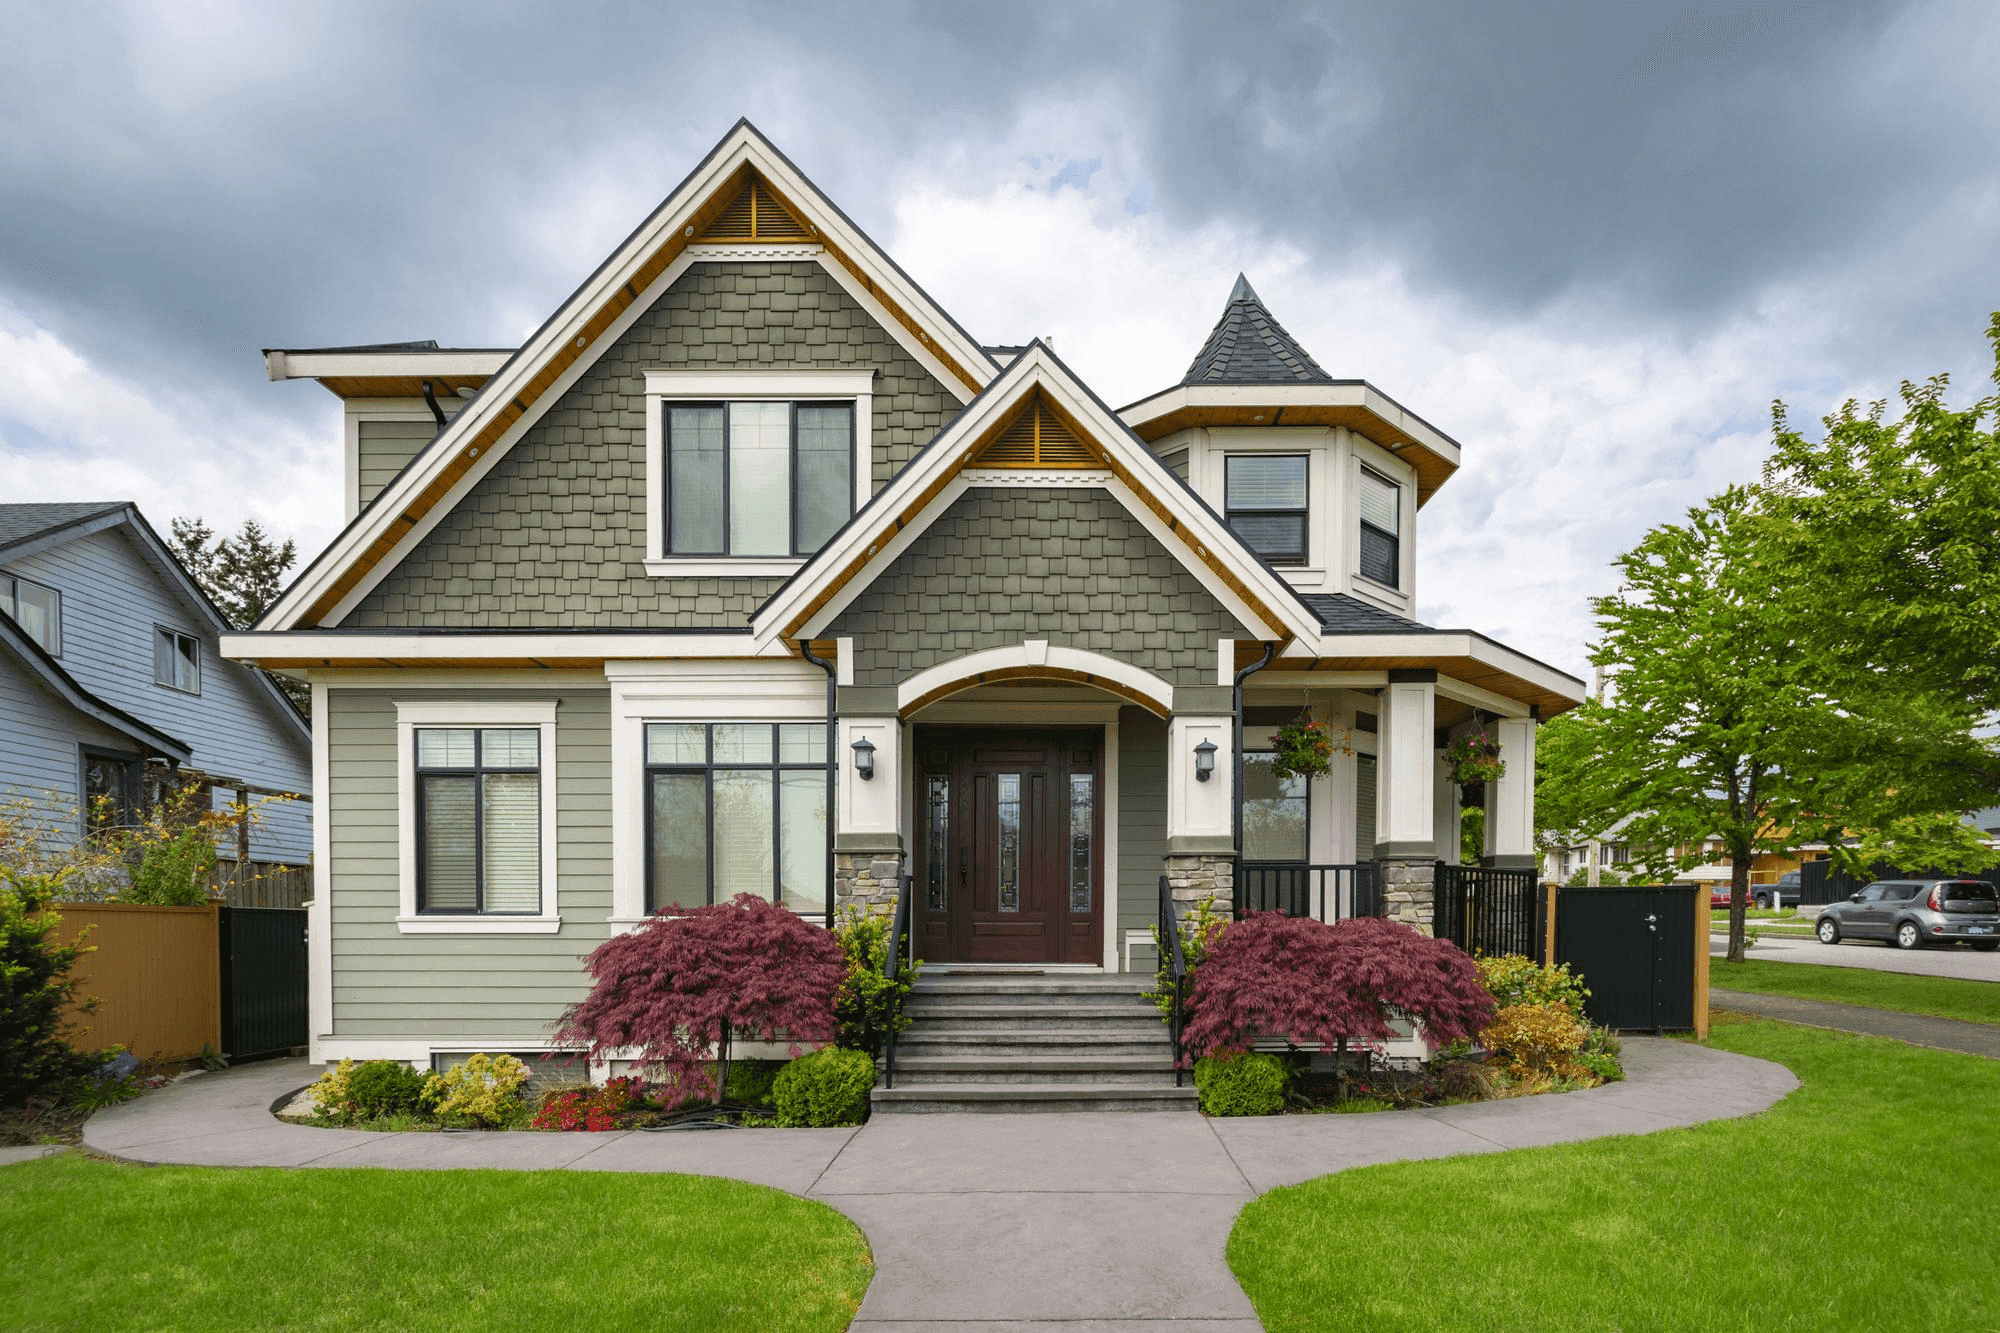
2026 Violent and Property Crime Rates in New York
New York's 2026 statewide baseline is 5.73 violent crimes and 23.72 property crimes per 1,000 residents. The state data shows substantial variation between communities.
Several communities report considerably lower local crime figures.
New York 2026 Crime Examples
| Community | 2026 Violent Crime | 2026 Property Crime |
|---|---|---|
| Lewisboro | 0.25 per 1,000 | 2.35 per 1,000 |
| Rye | Very low | Very low |
| Bedford | Very low | Low |
| Scarsdale | Very low | Low |
The difference between the statewide figure and individual municipal figures demonstrates why local crime data provides additional context when evaluating safety.
New York's statewide figures provide a broad benchmark, but individual communities can show substantially different crime patterns. If you want to explore community-level safety data, see these safest places to live in New York.
2026 Violent and Property Crime Rates in New Jersey
New Jersey reports 2.64 violent crimes and 15.88 property crimes per 1,000 residents in the 2026 data.
Several New Jersey communities report particularly low rates.
| Community | 2026 Violent Crime | 2026 Property Crime |
|---|---|---|
| Vernon Township | 0.0 per 1,000 | 1.7 per 1,000 |
| Bernards Township | 0.1 per 1,000 | 1.8 per 1,000 |
| Jefferson Township | 0.2 per 1,000 | 1.9 per 1,000 |
These figures illustrate the difference between statewide crime statistics and municipal-level crime measurements.
hese municipal figures show why statewide averages do not describe every community. You can review additional community-level data in this guide to the safest places to live in New Jersey.
2026 Violent and Property Crime Rates in California
California's 2026 statewide rates are 4.24 violent crimes and 20.84 property crimes per 1,000 residents.
The 2026 city-level data identifies several communities with substantially lower violent-crime rates.
| City | 2026 Violent Crime | 2026 Property Crime |
|---|---|---|
| Danville | 0.6 per 1,000 | 5.9 per 1,000 |
| Rancho Santa Margarita | 0.8 per 1,000 | — |
| Lincoln | 0.9 per 1,000 | — |
| Moorpark | 1.0 per 1,000 | — |
| Yorba Linda | 1.0 per 1,000 | — |
| Poway | 1.4 per 1,000 | — |
The source states that its 2026 city comparison uses FBI-reported violent and property crime data and applies a population threshold to the cities included in the ranking.
California has substantial variation between statewide and city-level crime rates. For additional city-level comparisons, explore the safest cities to live in California.
Buying a Home? Get up to 1.5% Cash Back at Closing
Get pre-approved first, then start exploring homes knowing you can receive up to 1.5% of the home price back at closing.

2026 Violent and Property Crime Rates in Florida
Florida reports 3.96 violent crimes and 20.29 property crimes per 1,000 residents in 2026.
The 2026 city-level figures show substantial differences between communities.
| City | 2026 Violent Crime | 2026 Property Crime |
|---|---|---|
| Vero Beach | 0.3 per 1,000 | 2.7 per 1,000 |
| Safety Harbor | 1.3 per 1,000 | 7.0 per 1,000 |
| Dunedin | 0.8 per 1,000 | 9.3 per 1,000 |
| Hialeah Gardens | 0.6 per 1,000 | 10.2 per 1,000 |
| St. Cloud | 1.9 per 1,000 | 7.6 per 1,000 |
| Coral Springs | 1.3 per 1,000 | 11.1 per 1,000 |
| Miami Lakes | 1.0 per 1,000 | 13.2 per 1,000 |
| West Melbourne | 1.5 per 1,000 | 12.2 per 1,000 |
| Cutler Bay | 1.5 per 1,000 | 13.9 per 1,000 |
The data demonstrates why a Florida safety comparison benefits from examining individual communities instead of relying exclusively on the statewide rate.
Florida's statewide rate does not represent every municipality. To examine additional community-level crime data, explore the safest places to live in Florida.
2026 Violent and Property Crime Rates in Georgia
Georgia's 2026 statewide rates are 3.42 violent crimes and 19.76 property crimes per 1,000 residents.
Several Georgia communities report substantially lower crime rates.
| City | 2026 Violent Crime | 2026 Property Crime |
|---|---|---|
| Senoia | 0.2 per 1,000 | 2.1 per 1,000 |
| Auburn | 0.0 per 1,000 | 4.0 per 1,000 |
| Holly Springs | 0.0 per 1,000 | 4.8 per 1,000 |
| Grovetown | 0.6 per 1,000 | 2.0 per 1,000 |
| Jefferson | 0.3 per 1,000 | 4.6 per 1,000 |
| Tyrone | 0.5 per 1,000 | 4.7 per 1,000 |
| Peachtree City | 0.2 per 1,000 | 8.0 per 1,000 |
| Johns Creek | 0.3 per 1,000 | ~0.32 per 1,000 |
The Georgia methodology combines the latest available FBI crime data with additional city-level crime and community information.
Georgia's statewide figures provide context, while municipal data shows differences between individual communities. You can explore additional local comparisons in this guide to the safest places to live in Georgia.
What Should You Check When Comparing 2026 Crime Rates?
A 2026 crime comparison should examine both violent and property crime because the two measures describe different types of offenses.
- Compare violent crime rates per 1,000 residents.
- Compare property crime rates separately.
- Check city-level data instead of relying only on statewide averages.
- Review reporting methodology before comparing different datasets.
- Check population coverage for city rankings.
- Examine crime figures together rather than relying on one statistic.
- Distinguish reported crime rates from general perceptions of safety.
- Check the geographic area represented by each crime figure.
Why Do City Crime Rates Differ From Statewide Rates?
Statewide crime rates combine many different communities into one measurement. Large metropolitan areas, suburbs, small towns, and rural communities can have different reported crime patterns.
The 2026 data illustrates this difference across all five states. New Jersey's statewide violent-crime rate is 2.64 per 1,000, while Vernon Township reports 0.0 per 1,000. Florida's statewide rate is 3.96 per 1,000, while Vero Beach reports 0.3 per 1,000. Georgia's statewide rate is 3.42 per 1,000, while Senoia reports 0.2 per 1,000.
This variation makes municipality-level crime rates useful when you are evaluating a particular location.
Bottom Line
The 2026 crime data shows substantial variation in violent and property crime rates across U.S. states and individual communities. Statewide figures provide useful context, but city-level statistics reveal important differences within each state. For an accurate 2026 safety comparison, examine violent crime and property crime separately, use the same population-based measurement, and verify the geographic area and methodology behind each figure.
2026 Violent and Property Crime Rate FAQs
What is the violent crime rate in New York in 2026?
New York's 2026 statewide violent crime rate is 5.73 incidents per 1,000 residents.
What is the violent crime rate in New Jersey in 2026?
New Jersey's 2026 violent crime rate is 2.64 incidents per 1,000 residents.
What is the violent crime rate in California in 2026?
California's 2026 violent crime rate is 4.24 incidents per 1,000 residents.
What is the violent crime rate in Florida in 2026?
Florida's 2026 violent crime rate is 3.96 incidents per 1,000 residents.
What is the violent crime rate in Georgia in 2026?
Georgia's 2026 violent crime rate is 3.42 incidents per 1,000 residents.
What is the property crime rate in New York in 2026?
New York's 2026 statewide property crime rate is 23.72 incidents per 1,000 residents.
What is the property crime rate in New Jersey in 2026?
New Jersey's 2026 property crime rate is 15.88 incidents per 1,000 residents.
What is the property crime rate in California in 2026?
California's 2026 property crime rate is 20.84 incidents per 1,000 residents.
What is the property crime rate in Florida in 2026?
Florida's 2026 property crime rate is 20.29 incidents per 1,000 residents.
What is the property crime rate in Georgia in 2026?
Georgia's 2026 property crime rate is 19.76 incidents per 1,000 residents.
Get the latest market trends, homebuying tips, and insider updates—straight to your inbox. No fluff, just the good stuff.
Article by
As a great communicator with excellent negotiation skills, I focus more on establishing unbreakable ties between my clients, as opposed to just helping them achieve their real estate dreams. As a representative of both buyers and sellers, I understand how to lead a transaction process to ensure that the needs of both are met. My track record speaks for itself. Since I ventured into the industry in 2013 as a realtor, I have not only helped many buyers land perfect homes, but I have also assisted tons of owners and investors build wealth.